This report presents the results of the 2025 Jersey Opinions & Lifestyle Survey (JOLS). The survey collects detailed information on a wide range of topics on an annual basis to provide everyone in the Island with a better understanding of social issues in Jersey, primarily so that policy decisions can be made from a more informed standpoint.
This year’s report takes a new format, offering a high-level snapshot of the most relevant findings. To complement this, a data explorer (see below) will allow users to explore the data in more detail. In addition, separate stakeholder reports have been prepared for those whose question requests were included in the 2025 JOLS. These reports offer deeper insight into the specific topics they requested.
Data explorer
Link to our data explorer to explore all JOLS data for yourself.
Finances

Overall, just under a third (30%) of households found it difficult to cope financially; down from more than a third (35%) in 2024.
Two-thirds (69%) of single parent households found it difficult to cope financially, compared to 17% of pensioner households.
Households were also more likely to find it difficult to cope financially if:
- they lived in non-qualified (52%) or social rental (55%) housing
- they lived in a bedsit (59%)
- they were Portuguese or Madeiran (60%)

Overall, two-fifths (41%) of households went without at least one item in the last 12 months, similar to 2023 (43%) but greater than in 2017 (34%).
A third (33%) of households were unable to afford an unexpected, but necessary, expense of £1,400 . One in five (22%) households living in rural parishes were unable to afford an unexpected expense, rising to 45% of households in St Helier.

Debit or credit card was the most popular method of payment, with nearly all (96%) adults using this method in the last month. The other three methods had clear age trends:
- more than four-fifths (86%) of 16- to 34-year-olds had used mobile or internet banking, compared to three-fifths (63%) of adults aged 65 and over
- three-fifths (61%) of 16- to 34-year-olds had paid using cash, compared to 74% of adults aged 65 and over
- one in fifty (2%) 16- to 34-year-olds had paid using cheque, compared to more than one in three (37%) adults aged 65 and over
For adults aged 65 and over, cash (74%) was more popular than mobile or internet banking (63%).
The most common uses for cash were: buying food or drink at a supermarket, store or other shop (63%); leaving a tip (59%); and eating or drinking at cafes, restaurants, pubs or bars (50%).

The most common reasons for paying with cash were: ‘it is convenient for small purchases’ (57%); ‘in case cards aren’t accepted’ (56%); and ‘to pay friends, family and other private people’ (27%).

Overall, more than three-quarters (77%) of adults agreed that businesses should be required to accept cash. This decreased to half (53%) of adults who never carry cash.
A series of questions were asked about the affordability of higher education.

Less than half (41%) of adults agreed that opportunities for higher education off-island are affordable; this compared to 74% who agreed on-island options are affordable.
Adults were broadly supportive of changes to the current student grant system, with three-quarters (73%) agreeing the level of financial support should be linked to a graduate’s return to Jersey; and four-fifths (81%) supportive of the government introducing student loans alongside grants.
Health

The proportion of adults with a long term health condition or illness (35%) has increased since 2017 (26%). This has been primarily driven by the increase in the proportion of 16- to 34-year-olds with a long-term health condition, from one in ten (12%) in 2017 to one in three (30%) in 2025.
One in five adults (22%) had, or were concerned they had, high blood pressure, while one in fourteen (7%) had, or were concerned they had Type 2 Diabetes.
One in seven (14%) identified as having a neurodiverse condition; the most common being ADHD (6%), dyslexia (5%) and autism (5%).

The proportion of adults who noticed they are hearing less well than two years ago increased with age, while the proportion who were seeing less well was highest for adults aged 45 to 54 years (62%).
Three-quarters (78%) of these had seen an optician, compared to 38% who had sought a hearing test.
Adults were asked to what extent they agreed with the statement “There is nothing anyone can do to reduce their risk of getting dementia”.

Overall, more than half (55%) of adults disagreed with the statement (i.e. felt there are things they can do to reduce their risk of dementia). This was higher for:
- adults with higher education qualifications (69%)
- younger adults – 62% of 16- to 34-year-olds, compared to 42% of adults aged 65 and over
- those who had relatives with dementia – 59% compared to 53% of those without

While the majority of adults agreed with the first three statements, fewer than half (47%) agreed there is a supportive environment for mothers to make their own feeding choices without feeling pressured. Women were more likely than men to agree with each of the statements, however differences were small.
Overall, four-fifths (79%) of adults were aware that women are allowed to breastfeed in a public place.
A third (33%) of workers said their employer provides rest breaks for breastfeeding mothers, while a quarter (23%) provide breastfeeding mothers with a private and hygienic space which is safe and secure.
Wellbeing
Adults were asked questions about their general wellbeing. Respondents scored themselves between 0 and 10, with 0 being ‘not at all’ and 10 being ‘completely’.
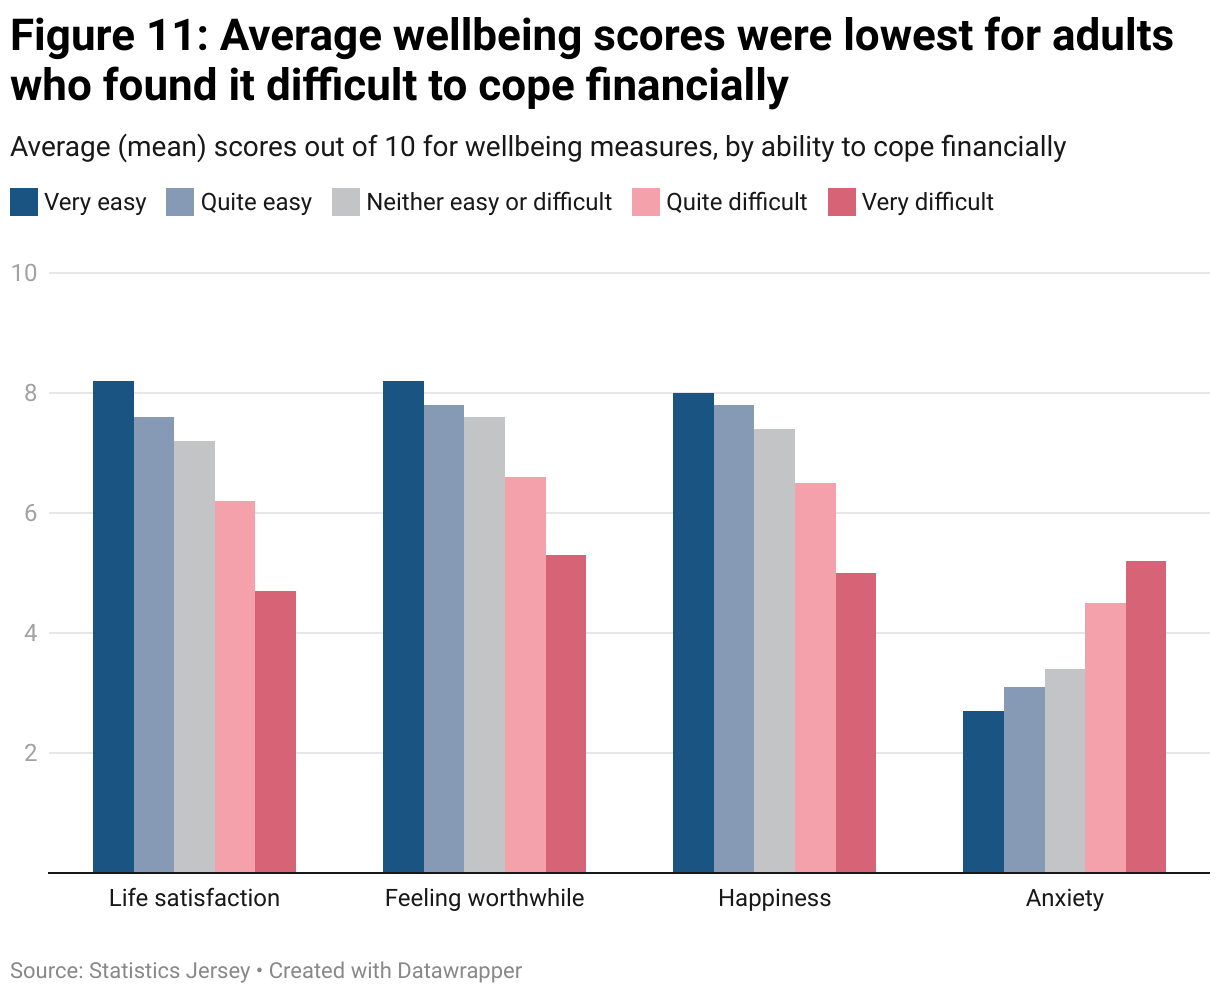
Overall, the scores for all four wellbeing measures remained similar to 2024. Average wellbeing scores improved with increased ability to cope financially.
Average scores for life satisfaction, feeling worthwhile and happiness dipped in midlife, with adults aged 45 to 54 years having the lowest scores. However, anxiety levels were highest for adults aged 16 to 34 years.

Overall, adults in the UK reported higher levels of life satisfaction, feeling worthwhile and happiness
(Office for National Statistics, 2025). These differences were starker for women than for men.
Anxiety levels were 6% lower for men and 15% lower for women in the UK than in Jersey.
Adults were asked if they felt they spent too much, too little or the right amount of time in three areas of their life (contact with family, other social contact, and hobbies or interests). These were combined into a time poverty index, with adults classified as ‘time sufficient’, ‘somewhat time poor’ or ‘very time poor’. For further information, please see methodology.

Overall, a quarter (26%) of adults were classified as ‘very time poor’, similar to 2024 (27%). Adults were more likely to be classified as ‘very time poor’ if they:
- found it difficult to cope financially – 42% compared to 14% of those who found it easy to cope financially
- had children – 38% compared to 21% of adults living in households without children
- were aged 35 to 44 years – 36% compared to 8% of adults aged 65 and over
Respondents were also asked about their sleep. More than half (56%) of adults got the recommended seven hours or more of sleep per night on average, with a third (34%) of all adults stating that poor sleep affects their day-to-day activities at least weekly.
Nearly two-thirds (65%) of adults who were ‘time sufficient’ met the sleep recommendations compared to 48% of adults who were ‘very time poor’.

The proportion of adults who socialise daily was lowest for adults aged 35 to 44 years (17%). This compares to nearly half (46%) of adults aged 65 and over.
The proportion of adults who socialise rarely or never has increased from 6% in 2018 to 12% in 2025.
The proportion of adults who feel lonely often or always was highest for adults aged 16 to 34 years (22%), compared to 12% of adults aged 65 and over.

More than four-fifths (83%) of adults used Facebook in the last week, which was the most popular social media platform followed by YouTube (65%) and Instagram (54%).
Adults aged 16 to 34 years were significantly more likely to use Instagram (74%), TikTok (38%) and X (31%) than adults aged 65 and over (24%, 6% and 9% respectively).
Lifestyle

Overall, the proportion of adults who were classified as overweight or obese (based on BMI calculation) has increased from 46% in 2017 to 56% in 2025. The proportion of men who were overweight or obese (66% in 2025) has been consistently higher than women (48% in 2025).
Around one in three (31%) adults ate the recommended 5 portions of fruit and vegetables in the previous 24 hours; this rose to 38% of adults who were a healthy weight.
Public Health England and the NHS recommend adults should aim for at least 150 minutes of moderate aerobic activity or 75 minutes of vigorous aerobic activity each week. For further information, please see methodology.

Overall, just over half (54%) of adults met the recommended levels of activity in a typical week, similar to 2023 (55%) but higher than 2019 (48%).
Adults were more likely to meet the recommended guidelines if:
- they were men – 61% of men compared to 48% of women
- they were younger – 61% of 16- to 34-year-olds compared to 48% of adults aged 65 and over
- they were in very good health – 73% compared to 21% in bad or very bad health
- they were ‘time sufficient’ – 67% compared to 46% of adults who were ‘very time poor’

Overall, one in ten (11%) adults were current smokers, while 9% used vapes sometimes, often or every day.
One in seven (15%) adults aged 16 to 34 years used vapes sometimes, often or every day; an increase since 2017 (4%). When combining with those who have tried vapes once or twice, the proportion increases to nearly half (46%) of this age group.
One in eight (13%) current smokers also used e-cigarettes sometimes, often or every day; this is a decrease on 2024 (27%).

The proportion of adults who never drink alcohol (16%) has increased since 2018 (11%). Women (19%) were more likely to be tee-total than men (13%).
One in six (15%) adults reported drinking more than the recommended weekly limit of 14 units of alcohol, down from 24% in 2020. Men (21%) were more likely to drink above the limit than women (10%).
The Fast Alcohol Screening Test (FAST) is a screening tool designed to highlight potentially harmful or hazardous drinking behaviours. Overall, a quarter (26%) of drinkers were drinking alcohol at potentially harmful or hazardous levels (FAST score of 3 or above), similar to 2024 (25%). For further information on FAST score calculation, please see methodology.
Data on diet, physical activity, smoking and drinking can be combined into a single index to count the number of ‘healthy behaviours’ each adult reported. This index combines behaviours which have health consequences, particularly in combination.

The following behaviours are considered healthy if:
- Physical activity – meets the recommended weekly levels of activity
- Diet – consumes 5 or more portions of fruit and vegetables the day before the survey
- Smoking – doesn’t currently smoke
- Alcohol – does not drink at potentially harmful or hazardous levels (FAST score of under 3)
A score of 4 indicates that all four healthy behaviours are reported.
Overall, around one in seven (15%) adults reported 4 healthy behaviours, while one in eight (12%) reported 0 or 1 healthy behaviours.
One in twelve (8%) adults aged 16 to 34 years reported 4 healthy behaviours; this rose to one in five (22%) adults aged 65 and over.
One in ten (10%) adults who found it difficult to cope financially reported 4 healthy behaviours; this rose to one in five (20%) who found it easy.
Our community

Overall, just under half (44%) of adults had volunteered in the last 12 months, a similar proportion to 2024 (43%) and higher than in 2022 (35%).
This has been mostly driven by an increase in men volunteering, from 33% in 2022 to 47% in 2025.
Men were more likely than women to volunteer in sport, community groups and other charities; while women were more likely than men to volunteer in health, religion and education.
A series of questions asked how much people trusted a range of civic or other community institutions. Adults were asked to rate their trust on a scale from 1 to 10, where 1 is ‘not at all’ and 10 is ‘completely’.

Nearly all institutions saw an increase in their average trust rating since 2024, reversing the trend since 2022. Only the Honorary Police did not see an increase in their average rating but instead stayed the same.
Government departments saw the greatest increase in trust since 2024; the average rating increased from 5.2 in 2024 to 5.9 in 2025.

Women were significantly less likely than men to feel very safe in each of the places in Jersey. When combining ‘very safe’ and ‘fairly safe’, men and women were statistically similar in each scenario in the day, however men were more likely to feel safe after dark.
These proportions were higher than in the UK (Office for National Statistics, 2022). On average, the proportion of men who felt very safe in each scenario was 25 percentage points higher in Jersey than the UK. Likewise, the proportion of women who felt very safe in each scenario was 20 percentage points higher than in the UK, though this difference was starker for the scenarios in the day (26 percentage points) than in the dark (15 percentage points).

Men (49%) were more likely than women (28%) to strongly agree that Jersey is a safe place for everyone.

Adults were most concerned about digital crime, with more than half (56%) of adults concerned they may become a victim in the next 12 months. Two-thirds (66%) of adults aged 55 to 64 years were concerned about digital crime, compared to 38% of 16- to 34-year-olds.
Three-quarters (77%) of adults agreed the police would do a good job if they needed them.

Overall, a quarter (23%) of adults had been discriminated against in Jersey in the last 12 months; this increased to nearly a third (30%) of 16- to 34-year-olds.
Of adults who had been discriminated against, a quarter (25%) reported the incident to the police.
Adults were asked two questions about their awareness of risks to their personal information and their confidence in managing these. The results to these two questions were combined into a vulnerability score.

The proportion of adults classified as low vulnerability was greater for:
- men – 16% of men compared to 11% of women
- younger adults – 21% of 16- to 34-year-olds compared to 6% of adults aged 65 and over
- those who found it easy to cope financially – 20%, compared to 10% of those who found it difficult

Overall, fewer than half (48%) of adults felt very comfortable using online government forms.
Adults aged 65 and over were consistently less likely to feel very comfortable completing each of the activities either online or via an app.
The main barriers or concerns to completing these activities online were: fear of scams or fraud (61%), privacy or security concerns (52%), and websites/apps not being easy to navigate (20%). A quarter (24%) of adults said they had no concerns about doing things online.
Adults were asked the extent to which they supported a range of measures on fireworks.

Overall, the majority of adults were in support of requiring organisers to inform local residents (86%); time limits on the sale and use of fireworks (75%) and limiting the amount of noise fireworks can make (66%).
More than three-quarters (78%) of adults were opposed to a total ban on fireworks.
Adults were more likely to support changes to the current rules on fireworks if they were women; aged 65 and over; and did not have children in their household.
Transport and environment

More than half (54%) of adults visited beaches at least weekly, compared to a third (32%) who visited inland paths and woods, and coastal paths.
Adults living in St Helier were less likely to visit coastal paths (26%) and inland paths (25%) on a weekly basis than those living in other parishes.
The most common reasons that prevented people from visiting the natural environment were lack of time (26%) and the terrain being too difficult (10%). Three-fifths (59%) of adults stated nothing prevents them from visiting the natural environment.
Overall, two-thirds (68%) of adults felt accessing Jersey’s natural environment was very important to them.

Overall, around a third (32%) of adults used active travel (walking, wheeling, cycling or running) for most of their journeys in a typical week. A similar proportion (29%) never used active travel.
More than half (58%) of adults living in St Helier used active travel for most of their journeys, compared to 12% living in rural parishes.
The incentives that would most encourage active travel were financial support to purchase equipment (21%), better facilities at their destination (21%) and a place to store their bicycle near their destination (19%). Two-fifths (38%) of adults stated nothing would encourage them to use active travel.

Looking only at commuting journeys, the gap between the proportion of adults who travel to work by private vehicle and by sustainable transport has decreased over time, from 16% in 2017 to 4% in 2025.
Nearly three-quarters (72%) of workers living in St Helier walked or cycled to work, compared to 18% of workers living in rural parishes. This excludes adults who work from home.
The majority of workers (who worked for an employer and did not work from home on a typical day) had facilities to encourage them to use active transport: 69% had bike parking; 66% had showers; 61% had changing rooms and 58% had storage lockers.
Data sources and methods
Overview and methodology
The methodology report for the Jersey Opinions & Lifestyle Survey details the design and analytical approach used in the survey. It includes information on sampling and response rates, weighting and confidence intervals, and defines key terms included within the report.
Data tables
Data can be explored across topics and years via our Power BI dashboard.
Stakeholder reports are available on stats.je.
Data tables are available on our Open Data site.
Sample and response rate
More than 4,000 households were selected at random to complete the survey between May and July 2025. Around 1,400 people completed the survey questionnaire, a response rate of 35%.
Statistical weighting techniques have been used to compensate for different patterns of non-response from different sub-groups of the population. The survey results can therefore be considered broadly representative of Jersey’s population. All analysis presented in this report uses weighted responses.
For more information, please see the methodology report.
Confidence intervals
For full information on the calculation of confidence intervals, please see the methodology report. In respect of the JOLS 2025 response rate, this methodology gives the following maximum confidence intervals for proportions:
- all adults: ± 3%
- age group: between ± 4% (age 65+ years) and ± 8% (age 16-34 years)
- parish: St Helier ± 5%; suburban (St Brelade, St Clement and St Saviour) ± 4%; rural ± 4%
- tenure: owner-occupiers ± 3%; qualified rent ± 6%; social rent ± 9%; non-qualified accommodation ± 14%; NOT owner-occupiers ± 5%
For analysis based on the mean values of numeric values, rather than percentages of the population, the confidence intervals are as follows:
- positive wellbeing scores: ± 0.1
- anxiety wellbeing score: ± 0.2
- trust in institutions: ± 0.1
Next publication
The Jersey Opinions and Lifestyle Survey for 2026 is scheduled for release in December 2026. Further scheduled publications can be found in our release calendar.