The Retail Prices Index (RPI) is the main measure of inflation in Jersey.
It measures the average change in prices of goods and services purchased by households and is sometimes referred to as the ‘cost of living’.
Latest figure
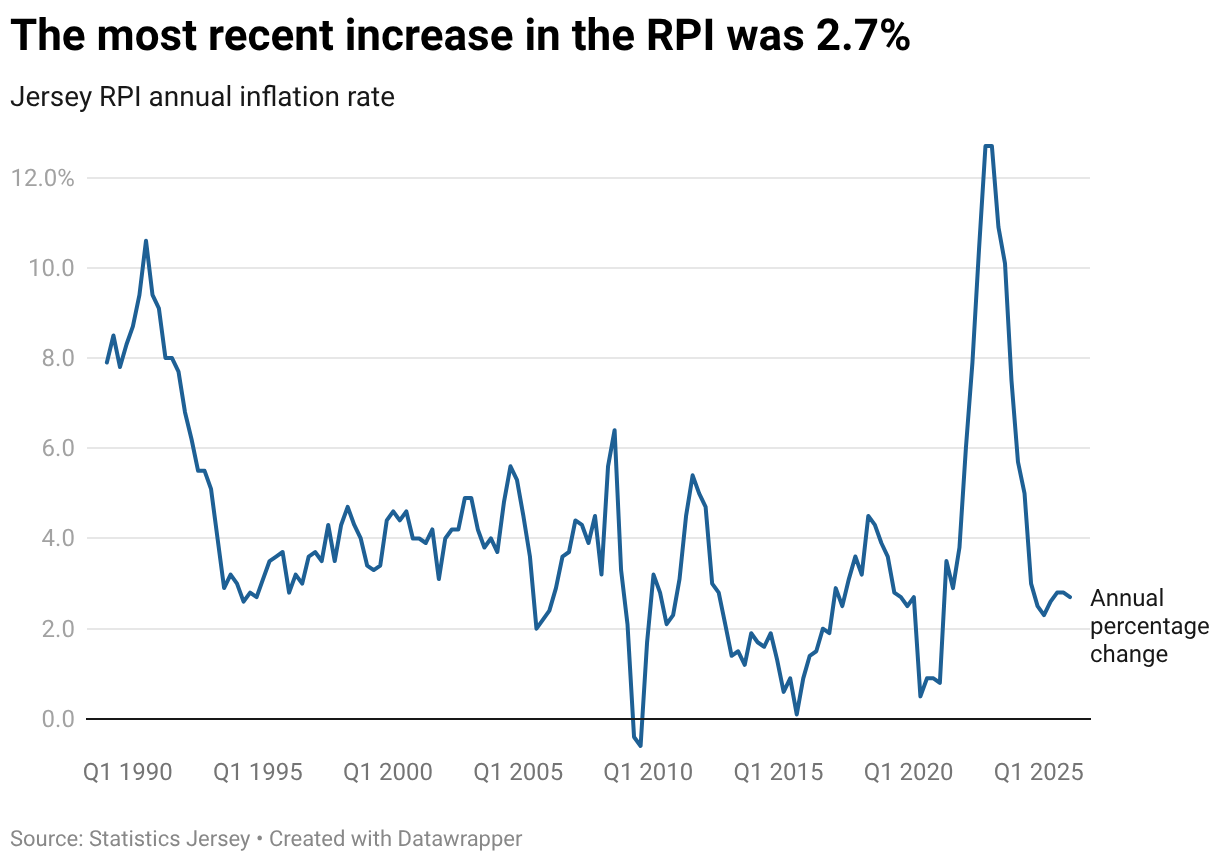
The most recently published RPI inflation rate is:
2.7%
Annual change to March 2026.
Inflation calculator
RPI over time
The annual percentage changes in the RPI since March 1989 are shown in the chart below.
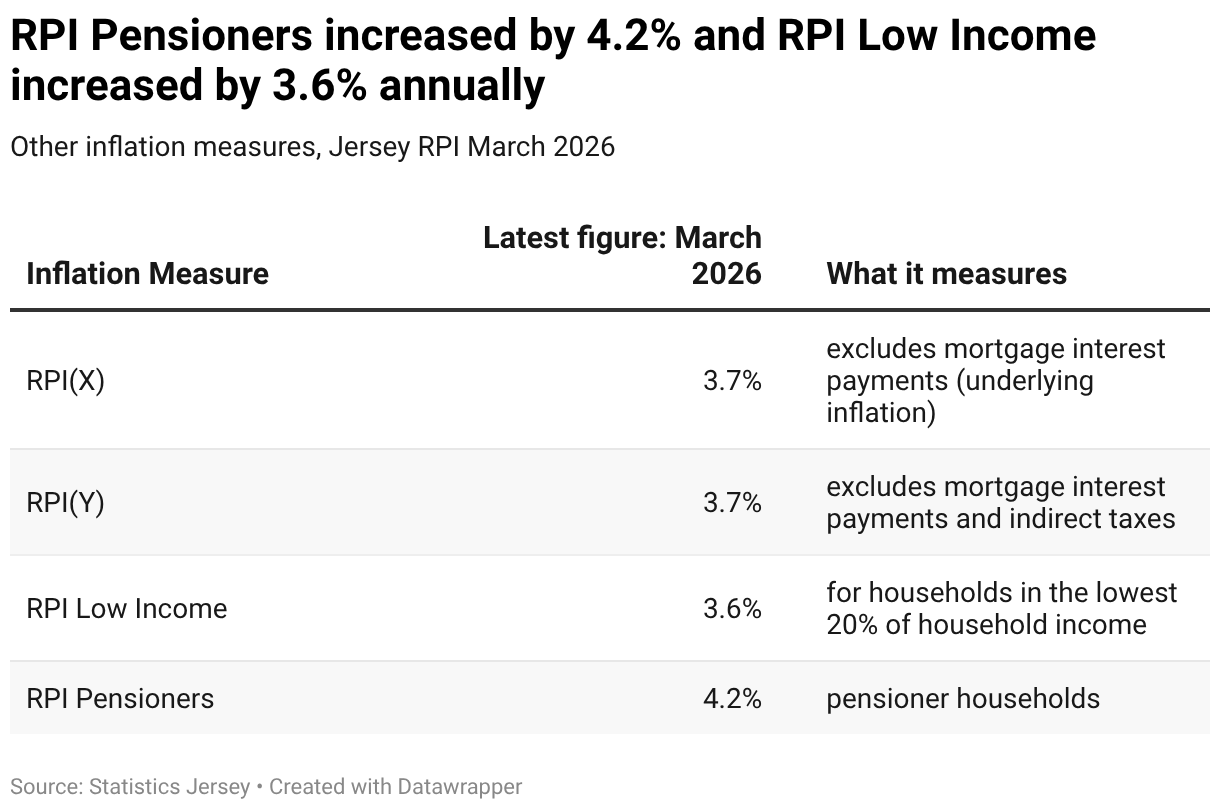
Other inflation measures
As well as the headline (All Items) RPI we also produce four other inflation measures:
Inflation forecasts
The Fiscal Policy Panel oversees the production of assumptions about the Jersey economy, including for inflation.
Retail price comparisons
In 2013, a one-off exercise was conducted to compare price levels between goods and services in Jersey and the UK.
Detailed price information for Jersey (over 4,000 prices) were matched to each of the UK regions (over 400,000 prices). Ideally, this exercise would be repeated at regular intervals to give updated figures however due to the comprehensive price data required from both jurisdictions, it has not yet been possible to repeat this study.
The percentage difference in price levels between Jersey and the UK was calculated for nine broad expenditure categories.
Percentage difference in price levels between Jersey and the UK in 2013
The overall price level for consumer goods and services in Jersey, including housings costs, education and health, was a fifth (20%) greater than the UK average.
Data sources and methods
Please see our Retail Prices Index methodology document for detailed information on how the Jersey RPI is produced.
Comprehensive information on household spending (from the Living costs and household income survey) is combined with prices of around 2,500 goods and services, which are collected every 3 months from 300 retailers, including online.
The prices are matched to the prices collected in the previous quarter, and the individual price changes are combined together to give a single overall increase. The contribution of each price change to the overall increase depends on how much the average household spends on each item.
Find data and past reports
Find past reports on our release calendar.
The most recent retail price comparison reports are Jersey-UK Relative Consumer Price Levels for Goods and Services 2013 and Changes in retail prices Jersey and UK June 2019.
You can find the RPI data on the open data website.